Social Finance -- Online Appendix and Notebook 4
This notebook implements the Selfish Equity extension of the social finance model described in Section 6 and Appendix B of the paper main.tex.
Theoretical Background
In our baseline model (explored in 2-socfin_m.ipynb), we assumed a highly competitive or altruistic market where the opportunity cost of MFI monitoring equity capital was exactly equal to the cost of uninformed debt capital (i.e. ).
However, in most real-world contexts, informed monitoring capital is highly scarce. Specialized managers, loan officers, and screeners represent scarce resources. Under a commercial or profit-driven intermediation regime, monitoring equity investors demand an expected rate of return on their equity capital in excess of the cost of debt:
This ROE hurdle rate introduces two critical economic frictions:
“Wasteful Over-Monitoring”: To deliver a higher expected return to the monitor while maintaining borrower incentives, the contract must adjust. For any given level of pledgeable assets , borrowers are subjected to more intensive active monitoring than they would choose under a competitive or social lender.
“Leverage Rationing”: To keep the monitor’s incentives credible under a high return rate , the monitor must retain a deeper equity stake in each loan. Furthermore, the loan fixed operational cost must always be financed out of MFI equity capital (at opportunity cost ). Thus, the total MFI equity per loan is:
where . The leverage ratio (debt-to-equity) is therefore:
As the required ROE rises, the MFI is forced to hold more skin in the game, restricting its ability to leverage outside commercial funds and limiting its borrower outreach .
Natural Leverage Bounds
Since , this formulation naturally bounds the maximum leverage ratio at:
This bounds leverage using only the physical parameters of the loan ( and ), without needing an ad-hoc regulatory Capital Adequacy Ratio (CAR) constraint.
Economy-Wide Equilibrium
By “closing the model”, we solve for the economy-wide equilibrium return on equity that clears the market for a fixed total supply of informed capital . As rises, credit access falls and the demand for capital shrinks, yielding a unique market-clearing interest rate for social and commercial finance.
Source
%matplotlib inline
import sys
import os
import numpy as np
import matplotlib.pyplot as plt
from ipywidgets import interact, FloatSlider
from scipy.optimize import root_scalar

# Path configuration to find local packages
sys.path.append(os.path.abspath('..'))

# Autoreload settings useful while editing socialfinance.py
%load_ext autoreload
%autoreload 2

# Matplotlib styling
plt.rcParams['figure.figsize'] = (7.5, 5.5)
plt.rcParams['axes.grid'] = True
plt.rcParams['grid.linestyle'] = ':'
plt.rcParams['grid.alpha'] = 0.6

# Import the core Bank class
from socialfinance.socialfinance import Bank
1. Over-monitoring & Leverage Rationing: Social vs. Commercial MFI
Let’s visualize the impact of commercial ROE hurdles. We will compare a Baseline MFI accepting a return on equity exactly equal to the cost of debt () with a series of Commercial MFIs requiring ROE hurdle rates ranging from to (i.e. ).
The minimum collateral requirement for a leveraged MFI under selfish equity is:
And the minimum collateral for an equity-only MFI is:
Let’s initialize a range of pledgeable assets and create our MFI zones.
Source
A = np.linspace(0, 150, 500)

# Initialize the Baseline MFI
mfi_baseline = Bank(A, beta=1.0)

print("--- Model Parameters ---")
mfi_baseline.print_params()
--- Model Parameters ---
Amax = 140, B0 = 30, F = 0, I = 100, K = 10000, X = 200
alpha = 0.5, beta = 1.0, f = 20, gamma = 1.0, p = 0.97, q = 0.82
The Contract Space Envelope & Over-monitoring
The solid envelope represents the feasible contract frontier (the minimum collateral pledge required for each level of monitoring ).
Notice that as the required ROE shifts from the baseline 1.0 (blue) to the commercial steps from 1.1 to 1.5 (red gradient):
The minimum collateral requirement curve shifts upward.
The crossover point where the leveraged MFI and equity-only MFI cross shifts to the right.
This means that for any given asset level, commercial borrowers are subjected to progressively higher monitoring intensity and therefore higher interest rates to cover the monitor’s high ROE.
Source
fig, ax = plt.subplots(figsize=(8.5, 6.5))
mm = np.linspace(0, 80, 500)

# Plot the A_e(m) and A(m) baseline (beta=gamma=1.0)
ax.plot(mm, mfi_baseline.AMe(mm), linewidth=3.2, color='blue', label=r'Baseline MFI ($\beta = 1.0$)')

# Use a colormap to plot beta steps from 1.1 to 1.5
import matplotlib.cm as cm
betas = [1.1, 1.2, 1.3, 1.4, 1.5]
colors = cm.Reds(np.linspace(0.4, 1.0, len(betas)))

for b, color in zip(betas, colors):
    mfi_temp = Bank(A, beta=b)
    mmax_temp = mfi_temp.mmax()
    if mmax_temp > 0:
        mm_env = np.linspace(0, mmax_temp, 500)
        ax.plot(mm_env, mfi_temp.Abest(mm_env), linewidth=1.8, color=color, linestyle='--',
                label=rf'Commercial $\beta = {b:.1f}$ (ROE = {(b-1.0)*100:.0f}%)')

ax.set_title("Minimum Collateral Requirements: Over-Monitoring under Hurdle ROE", fontsize=12, weight='bold')
ax.set_xlabel("Monitoring intensity $m$", fontsize=10)
ax.set_ylabel("Pledgeable assets $A(m)$", fontsize=10)
ax.set_xlim(0, 80)
ax.set_ylim(0, 160)
ax.legend(fontsize=9, loc='upper right')
plt.tight_layout()
os.makedirs('figs', exist_ok=True)
plt.savefig('figs/fig-crossover-compare.png', dpi=300)
plt.show()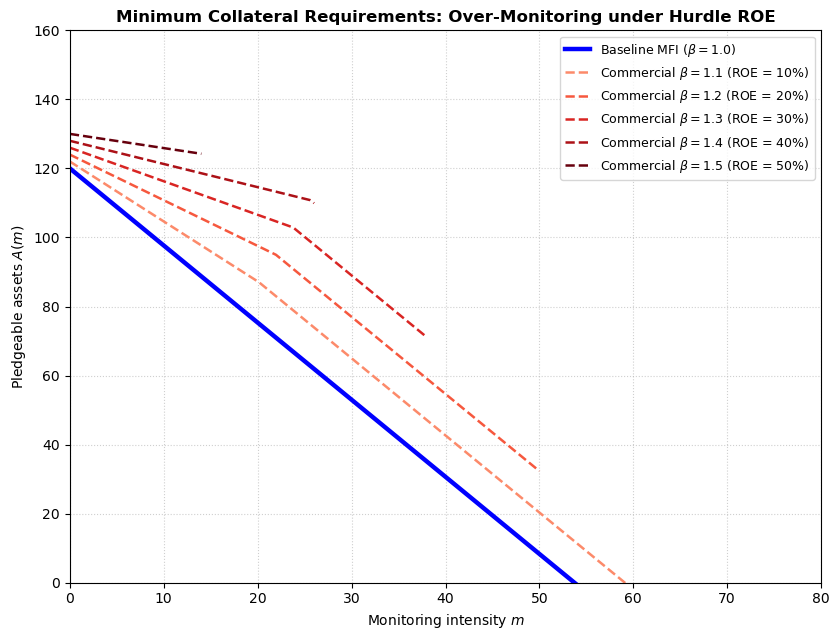
Leverage Rationing & Debt-to-Equity Compression
As the MFI’s hurdle ROE rises, outside uninformed investors demand that the MFI invest more of its own capital per loan to align incentives. Since operational cost is equity-financed, the leverage ratio collapses.
The plot below maps the debt-to-equity ratio across different pledgeable asset levels. Note how the commercial leverage curves (red gradient) sit significantly below the baseline, and are naturally capped at , showing how commercial profit-maximizing hurdles restrict leverage and limit the scale of financial inclusion.
Source
fig, ax = plt.subplots(figsize=(8.5, 6.0))

# Baseline (beta = 1.0) - leverage is capped at I/f under equity-funded operational cost f
# Plot the leverage curves for beta steps from 1.1 to 1.5
import matplotlib.cm as cm
betas = [1.1, 1.2, 1.3, 1.4, 1.5]
colors = cm.Reds(np.linspace(0.4, 1.0, len(betas)))

for b, color in zip(betas, colors):
    mfi_temp = Bank(A, beta=b)
    amin_temp = mfi_temp.Amin()
    A_temp = np.linspace(amin_temp, mfi_temp.AM(0), 100)[:-1]
    Im_temp = np.array([mfi_temp.Im(m) for m in mfi_temp.minmon(A_temp)])
    de_temp = np.divide(mfi_temp.I - Im_temp, Im_temp + mfi_temp.f, out=np.zeros_like(Im_temp), where=(Im_temp + mfi_temp.f)>0)

    ax.plot(A_temp, de_temp, label=rf'Commercial $\beta = {b:.1f}$ (ROE = {(b-1.0)*100:.0f}%)', color=color, linewidth=2)
    ax.axvline(x=mfi_temp.Across(), linestyle=':', color=color, alpha=0.6)

# Draw the natural leverage limit line
max_de = mfi_baseline.I / mfi_baseline.f
ax.axhline(y=max_de, color='red', linestyle='--', linewidth=2, alpha=0.7, label=f'Max Leverage ({max_de:.1f})')

ax.set_title(r"Debt-to-Equity Ratio $\frac{I - I^m}{I^m + f}$ under Scarce Equity and Operational Cost $f$", fontsize=12, weight='bold')
ax.set_xlabel("A -- pledgeable assets", fontsize=10)
ax.set_ylabel("Leverage Ratio", fontsize=10)
ax.set_xlim(20, 140)
ax.set_ylim(0, max_de * 1.25)  # dynamically sets y-limit to exactly 1.25 times the cap (6.25)
ax.legend(fontsize=9, loc='upper right')
plt.tight_layout()
plt.savefig('figs/fig-leverage-rationing.png', dpi=300)
plt.show()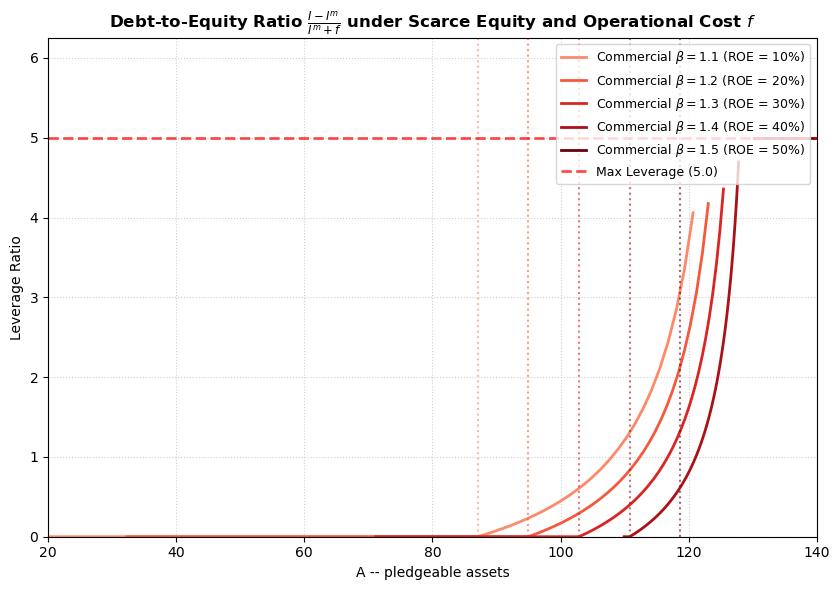
2. Closing the Model: Solving for Equilibrium ROE 
Now we will implement the general equilibrium module that clears the capital market for MFI monitoring equity.
Market-Clearing Mechanics
Let there be a continuum of segregated neighborhoods indexed by average wealth . Each neighborhood has potential borrowers.
The MFI equity capital used in neighborhood for a given ROE is:
The total economy-wide MFI equity capital demanded is:
We define a vectorized function to compute and solve for the equilibrium that satisfies .
Source
# Neighborhoods and borrowers setup
beta_vals = np.linspace(1.0, 2.0, 100)
A_grid = np.linspace(0, 150, 1000)
N_potential = 20.0  # potential borrowers per neighborhood
K_total = 500000.0  # Total economy-wide supply of intermediary equity capital

# Solve the model using refactored Bank class methods
beta_star = Bank.solve_equilibrium(A_grid, K_total, N_potential, bracket=[1.0, 2.5])

print(f"Market-Clearing Equilibrium ROE (beta*) = {beta_star:.5f}")
Market-Clearing Equilibrium ROE (beta*) = 1.34073
Source
kd_vals = [Bank(A_grid, beta=b).capital_demand_grid(A_grid, N_potential) for b in beta_vals]

fig, ax = plt.subplots(figsize=(8, 5.5))
ax.plot(kd_vals, beta_vals, label=r"Capital Demand", color='purple', linewidth=2.5)
ax.axvline(x=K_total, color='green', linestyle='--', linewidth=2, label=r"Capital Supply $K_{total}$")

ax.plot(K_total, beta_star, 'ro', markersize=9, label=rf"Equilibrium ($\beta^* = {beta_star:.3f}$)")

ax.set_title("Equilibrium Return on Intermediary Capital", fontsize=12, weight='bold')
ax.set_xlabel("Total MFI Capital demanded / supplied", fontsize=10)
ax.set_ylabel(r"Return on Intermediary Equity $\beta$", fontsize=10)
ax.legend(fontsize=10)
plt.tight_layout()
plt.savefig('figs/fig-equilibrium-clearing.png', dpi=300)
plt.show()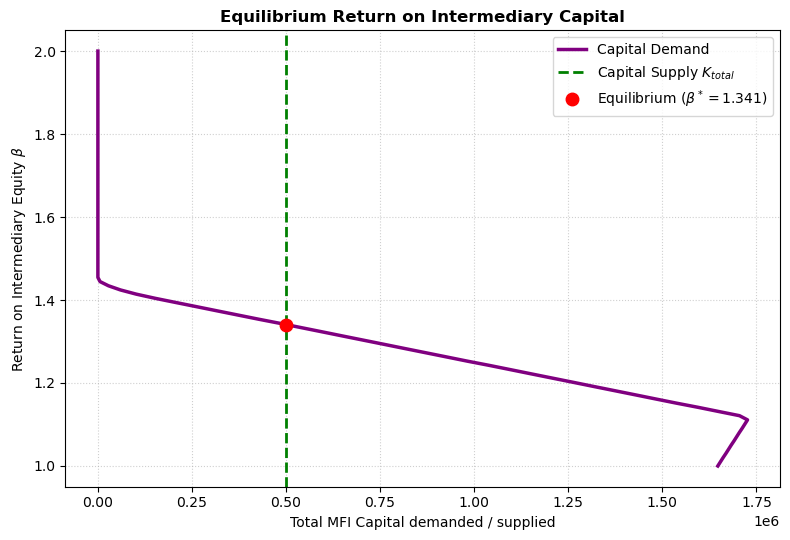
3. The Equilibrium Credit Landscape
Using our equilibrium ROE , let’s analyze the resulting credit landscape. We will plot the lending outreach (number of borrowers reached ) and the borrower net returns (welfare surplus) across the wealth distribution.
Source
# Initialize the bank under equilibrium beta*
eq_bank = Bank(A, beta=beta_star)
eq_bank.K = 10000.0  # MFI startup capital parameter

# Calculate borrower outreach N(A) and net returns
nr = eq_bank.nreach(A)
br = eq_bank.breturn(A)

fig, (ax1, ax2) = plt.subplots(2, 1, figsize=(8.5, 9.5))

# Plot 1: Outreach
ax1.plot(A, nr, color='teal', linewidth=3, label='Equilibrium Outreach $N(A)$')
ax1.axvline(x=eq_bank.Amin(), linestyle=':', color='grey', label='Excluded threshold')
ax1.axvline(x=eq_bank.Across(), linestyle=':', color='blue', label='Leverage threshold')
ax1.axvline(x=eq_bank.AM(0), linestyle=':', color='green', label='Direct banking threshold')
ax1.set_title("Equilibrium MFI Outreach by Borrower Asset Level", fontsize=11, weight='bold')
ax1.set_xlabel("Borrower pledgeable assets $A$", fontsize=9)
ax1.set_ylabel("Number of loans funded ($N$)", fontsize=9)
ax1.set_xlim(0, 140)
ax1.set_ylim(0, 350)
ax1.legend(fontsize=9)

# Plot 2: Borrower returns
ax2.plot(A, br, color='orange', linewidth=3, label='Borrower net return')
ax2.axvline(x=eq_bank.Amin(), linestyle=':', color='grey')
ax2.axvline(x=eq_bank.Across(), linestyle=':', color='blue')
ax2.axvline(x=eq_bank.AM(0), linestyle=':', color='green')
ax2.set_title("Equilibrium Borrower Returns by Asset Level", fontsize=11, weight='bold')
ax2.set_xlabel("Borrower pledgeable assets $A$", fontsize=9)
ax2.set_ylabel("Expected Net Surplus", fontsize=9)
ax2.set_xlim(0, 140)
ax2.set_ylim(0, 120)
ax2.legend(fontsize=9)

plt.tight_layout()
plt.savefig('figs/fig-equilibrium-landscape.png', dpi=300)
plt.show()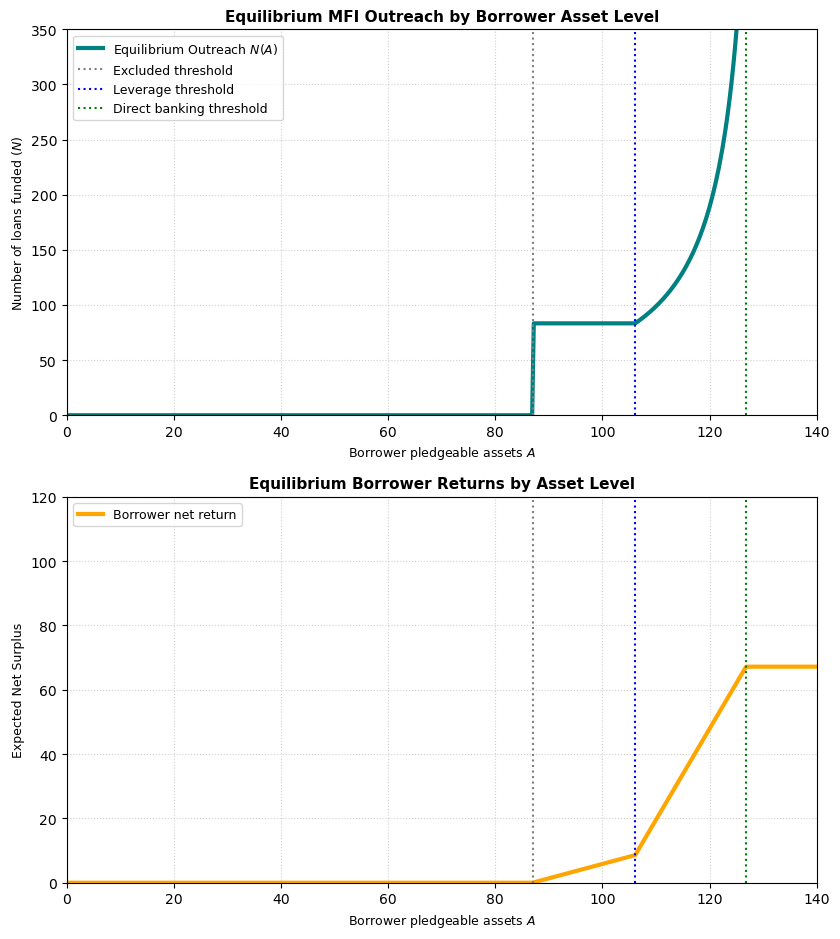
4. Interactive Capital Market & Policy Dashboard
Use the interactive dashboard below to explore in real-time how the capital market clears! You can vary the total intermediary capital supply (), the cost of uninformed debt (), the monitoring efficiency (), and the MFI fixed operational cost ().
The dashboard dynamically resolves the market-clearing equilibrium rate of return and updates the contract space plots instantly.
Source
def interactive_equilibrium(K_total_val=400000.0, gamma_val=1.0, alpha_val=0.5, f_val=20.0):
    # Close previous plots to avoid memory leakage
    plt.close('all')
    from IPython.display import clear_output
    clear_output(wait=True)

    # Solve for equilibrium under new parameters using refactored Bank class methods
    try:
        b_star = Bank.solve_equilibrium(
            A_grid, K_total_val, N_potential=N_potential, bracket=[1.0, 3.0],
            gamma=gamma_val, alpha=alpha_val, f=f_val
        )
    except ValueError:
        print("Market collapsed: Intermediary capital demand cannot match supply in this range.")
        return

    # Display solved value
    from IPython.display import display, Markdown
    display(Markdown(f"### **Solved Equilibrium Rate:** $\\beta^* = {b_star:.4f}$ (ROE = {(b_star-1.0)*100:.2f}%)"))

    # Draw the dynamic plots side-by-side (3-column layout)
    fig, (ax1, ax2, ax3) = plt.subplots(1, 3, figsize=(18, 5.5))

    # Left Plot: Capital Market Clearing
    b_test_range = np.linspace(1.0, 2.5, 50)
    kd_test_vals = []
    for b in b_test_range:
        tb = Bank(A_grid, beta=b, gamma=gamma_val, alpha=alpha_val, f=f_val)
        kd_test_vals.append(tb.capital_demand_grid(A_grid, N_potential))

    ax1.plot(kd_test_vals, b_test_range, color='purple', linewidth=2.5, label='Capital Demand')
    ax1.axvline(x=K_total_val, color='green', linestyle='--', linewidth=2, label='Capital Supply')
    ax1.plot(K_total_val, b_star, 'ro', markersize=9, label=rf'Equilibrium $\beta^*={b_star:.2f}$')
    ax1.set_title("Intermediary Capital Market Clearing", fontsize=12, weight='bold')
    ax1.set_xlabel("Total MFI Capital demanded / supplied", fontsize=10)
    ax1.set_ylabel(r"Return on Equity $\beta$", fontsize=10)
    ax1.legend()

    # Center Plot: Resulting Contract Envelope
    eq_mfi = Bank(A, beta=b_star, gamma=gamma_val, alpha=alpha_val, f=f_val)

    mm_range = np.linspace(0, 100, 500)
    ax2.plot(mm_range, eq_mfi.AMe(mm_range), linestyle=':', color='green', alpha=0.5, label='Equity-only MFI')
    ax2.plot(mm_range, eq_mfi.AM(mm_range), linestyle='--', color='purple', alpha=0.5, label='Leveraged MFI')

    mmax_val = eq_mfi.mmax()
    if mmax_val > 0:
        mm_env = np.linspace(0, mmax_val, 200)
        ax2.plot(mm_env, eq_mfi.Abest(mm_env), linewidth=3, color='blue', label='Feasible Frontier')
        ax2.axvline(x=mmax_val, linestyle='--', color='red', alpha=0.6, label='Max monitoring limit')

    ax2.set_title(r"Resulting Equilibrium Contract Space $A(m)$", fontsize=12, weight='bold')
    ax2.set_xlabel("Monitoring intensity $m$", fontsize=10)
    ax2.set_ylabel("Pledgeable assets $A(m)$", fontsize=10)
    ax2.set_xlim(0, 80)
    ax2.set_ylim(0, 160)
    ax2.legend()

    # Right Plot: Resulting Debt-to-Equity Ratio
    amin_eq = eq_mfi.Amin()
    A_temp = np.linspace(amin_eq, eq_mfi.AM(0), 100)[:-1]
    Im_temp = np.array([eq_mfi.Im(m) for m in eq_mfi.minmon(A_temp)])
    de_temp = np.divide(eq_mfi.I - Im_temp, Im_temp + eq_mfi.f, out=np.zeros_like(Im_temp), where=(Im_temp + eq_mfi.f)>0)

    ax3.plot(A_temp, de_temp, color='blue', linewidth=2.5, label='D/E Ratio')
    ax3.axvline(x=eq_mfi.Amin(), color='grey', linestyle=':', alpha=0.7, label=r'$A_{min}$')
    ax3.axvline(x=eq_mfi.Across(), color='blue', linestyle=':', alpha=0.7, label=r'$A_{cross}$')
    ax3.axvline(x=eq_mfi.AM(0), color='green', linestyle=':', alpha=0.7, label=r'$A(0)$')

    max_de = eq_mfi.I / eq_mfi.f
    ax3.axhline(y=max_de, color='red', linestyle='--', linewidth=2, alpha=0.7, label=f'Max Leverage ({max_de:.1f})')
    y_max = max_de * 1.25

    ax3.set_title("Resulting Debt-to-Equity Ratio", fontsize=12, weight='bold')
    ax3.set_xlabel("A -- pledgeable assets", fontsize=10)
    ax3.set_ylabel("Leverage Ratio", fontsize=10)
    ax3.set_xlim(amin_eq - 15, 140)
    ax3.set_ylim(0, y_max)
    ax3.legend(fontsize=9, loc='upper right')

    plt.tight_layout()
    plt.show()

# Interactive control sliders
interact(interactive_equilibrium,
         K_total_val=FloatSlider(min=200000.0, max=600000.0, step=25000.0, value=400000.0, description='Capital Supply'),
         gamma_val=FloatSlider(min=1.0, max=1.2, step=0.02, value=1.0, description='Debt Cost gamma'),
         alpha_val=FloatSlider(min=0.3, max=0.7, step=0.05, value=0.5, description='Monitoring alpha'),
         f_val=FloatSlider(min=0.0, max=30.0, step=5.0, value=20.0, description='Fixed Cost f'));